Danube Watch 1/2020 - Mapping Environmental Protection
Mapping Environmental Protection:
A Cartographer’s View on Europe's Second-longest River

It is quite interesting to observe the great variety in scale, levels of data precision and variety of data sources one can experience as a cartographer. Starting from a very narrow focus on details and gradually widening the scope, the development of my cartographic experience was in a sense replicating the way the river starts in a very narrow stream and widens into a broad delta at its end. As a young geodetic engineer, I was focused on millimetre precision while monitoring the movements of hydropower dams in order to measure deformation in time to prevent dam failure. Soon this focus on extreme detail was replaced with a quite different approach, where the input data was at best described in centimetres, and many times with much less precision (sometimes decimetres or worse), while determining the position of minefields left behind after the war.
In both cases, the failure to properly determine and visualise the data could have led to significant consequences and, in the worst case, even to the loss of life. But in the case of the minefields, there were safety buffer zones that were used for cartographic representations of the data, making it clear that it is not only the precision of data that matters, but that it is equally or even more important to properly determine a readable and meaningful cartographic representation.
Today, when I am mapping the Danube River Basin, there are also some challenges dealing with potentially very serious consequences (e.g. flood hazard maps) that can affect very large areas and population, and in this context, it is again most important to maximize map readability. Visual clarity and readability is constantly the focus of discussions with my colleagues in the ICPDR Secretariat when we consider the layout and contents of the maps that I prepare (e.g. for the Danube River Basin Management Plan or for the Danube Flood Risk Management Plan updates).
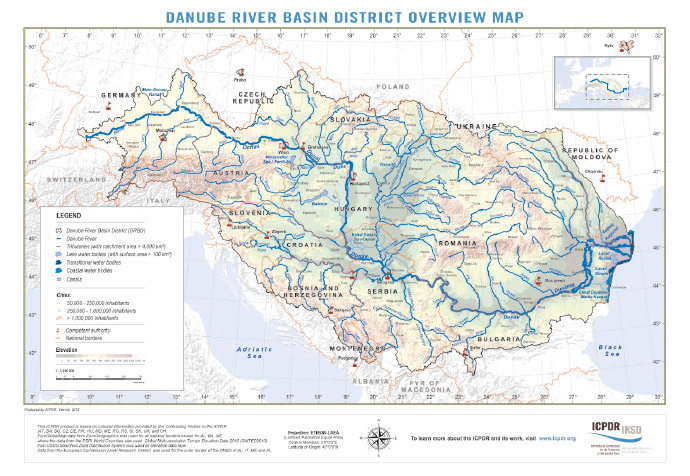
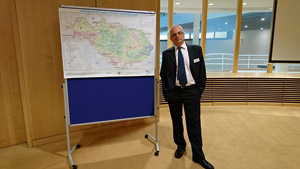
Most of the ICPDR maps are thematic maps produced at 1:4,500,000 (A3), or 1:6,000,000 (A4) scale. The only exception being the large Overview Map of the DRBD, which is produced as a wall map in an A0 size, at a scale of 1:1,500,000, and which primarily shows the topography of the Danube River Basin District (DRBD) with emphasis on the relief of the basin, which helps to illustrate how the current river drainage pattern was established through the ages.
At these scales, the question of input data positional accuracy becomes almost unimportant. On the other hand, the importance of quality and comparability of the attribute data input becomes immediately recognisable in the cartographic representation. This means that any mismatch in the understanding of the meaning of data attributes, or any methodological differences in data collection between the countries, may become clearly visible for the first time only once the map is produced. As for positional accuracy, it is important to recognise that the data is cartographically generalised, and that we are using the thresholds that are filtering only the data which is relevant on the DRBD level, i.e. only the rivers with catchments larger than 4,000 km2.
As the Danube River Basin (DRB) has an area of more than 800,000 km2, and data is provided by the 14 countries (through the ICPDR’s own information system called DanubeGIS), there are considerable challenges in producing maps that ensure a homogeneous overview of the themes that are of relevance to the ICPDR. Selecting the appropriate symbols and suitable shading of thematic areas are just some of the crucial requirements for a satisfying cartographic representation that provides both reasonable levels of detail and ensures the readability of DRB maps.
The challenges and benefits of transboundary cooperation can be much more easily observed and analysed when we achieve this goal of providing uniform and readable cartographic representation of the data throughout the Danube River Basin. The process of ICPDR map production is ongoing and constantly developing - corresponding with the ICPDR’s numerous tasks and activities.
Working with the data prepared and provided by the various ICPDR Member States is an interactive and intensive process. Updated data can be uploaded to the DanubeGIS system when required, but sometimes data changes and corrections can be necessary, leading to a situation where data uploads are repeated many times over. Consequently, the map drafts are also updated in order to reflect the changes in data. This constantly flowing stream of data can be likened to a river washing over the cartographer! It also can mean many map drafts get made again and again. It is not uncommon for a map to go through more than five drafts until a final version is made.
However, when a good map draft is prepared, it can be shown to ICPDR experts or Heads of Delegation who are often better able to consider the topic being mapped when able to visually take the information in. This can lead to the opportunity that a new approach to that particular topic can then be considered due to this new perspective that a good map visualisation provides. Sometimes there may be the situation that a map, once shown to a relevant expert or official, may show an unexpected result based on the newly updated data of the related theme. This can facilitate the consideration of various approaches to the theme, and highlight a need for a certain managerial approach. Either way, visual presentations of data reflected on a map can help to facilitate and guide decision-making at various levels.
Being a cartographer that primarily deals with rivers these days implies being aware of the need to provide clarity of information not only through paper maps but also through online services which are currently the main standard for the exchange of GIS information.
New technology does not only allow data to be efficiently uploaded into ICPDR's system when required, but also allows dozens of finished data maps to be provided online as web map services, where they can be accessed at any time by members of the public or utilised by professionals and students. The potential that these GIS services create for an expanded understanding of the Danube River Basin is significant, and was not possible back in the early stages of the DanubeGIS development, but was made possible due to the constant improvements and updates of the system functionalities. Utilising a DanubeGIS information system that functions as a well-established data collection and processing machine, I must acknowledge that my work depends on the expertise and contributions of my many colleagues from various water-related fields and from numerous countries. I am, therefore, always trying to make sure that their work too can depend on reliable and accurate mapping.

Zoran Major works as a Technical Expert for GIS, dealing with data management, mapping and GIS at the ICPDR Secretariat. Previous positions include Head of Unit for quality control of the Croatian National Mapping Agency and Head of Department for Database and GIS with the Croatian Environment Agency. Mr. Major also has extensive experience working in international organisations, on GIS and database issues from engagements in UN and NATO field missions (UNPROFOR and SFOR).


